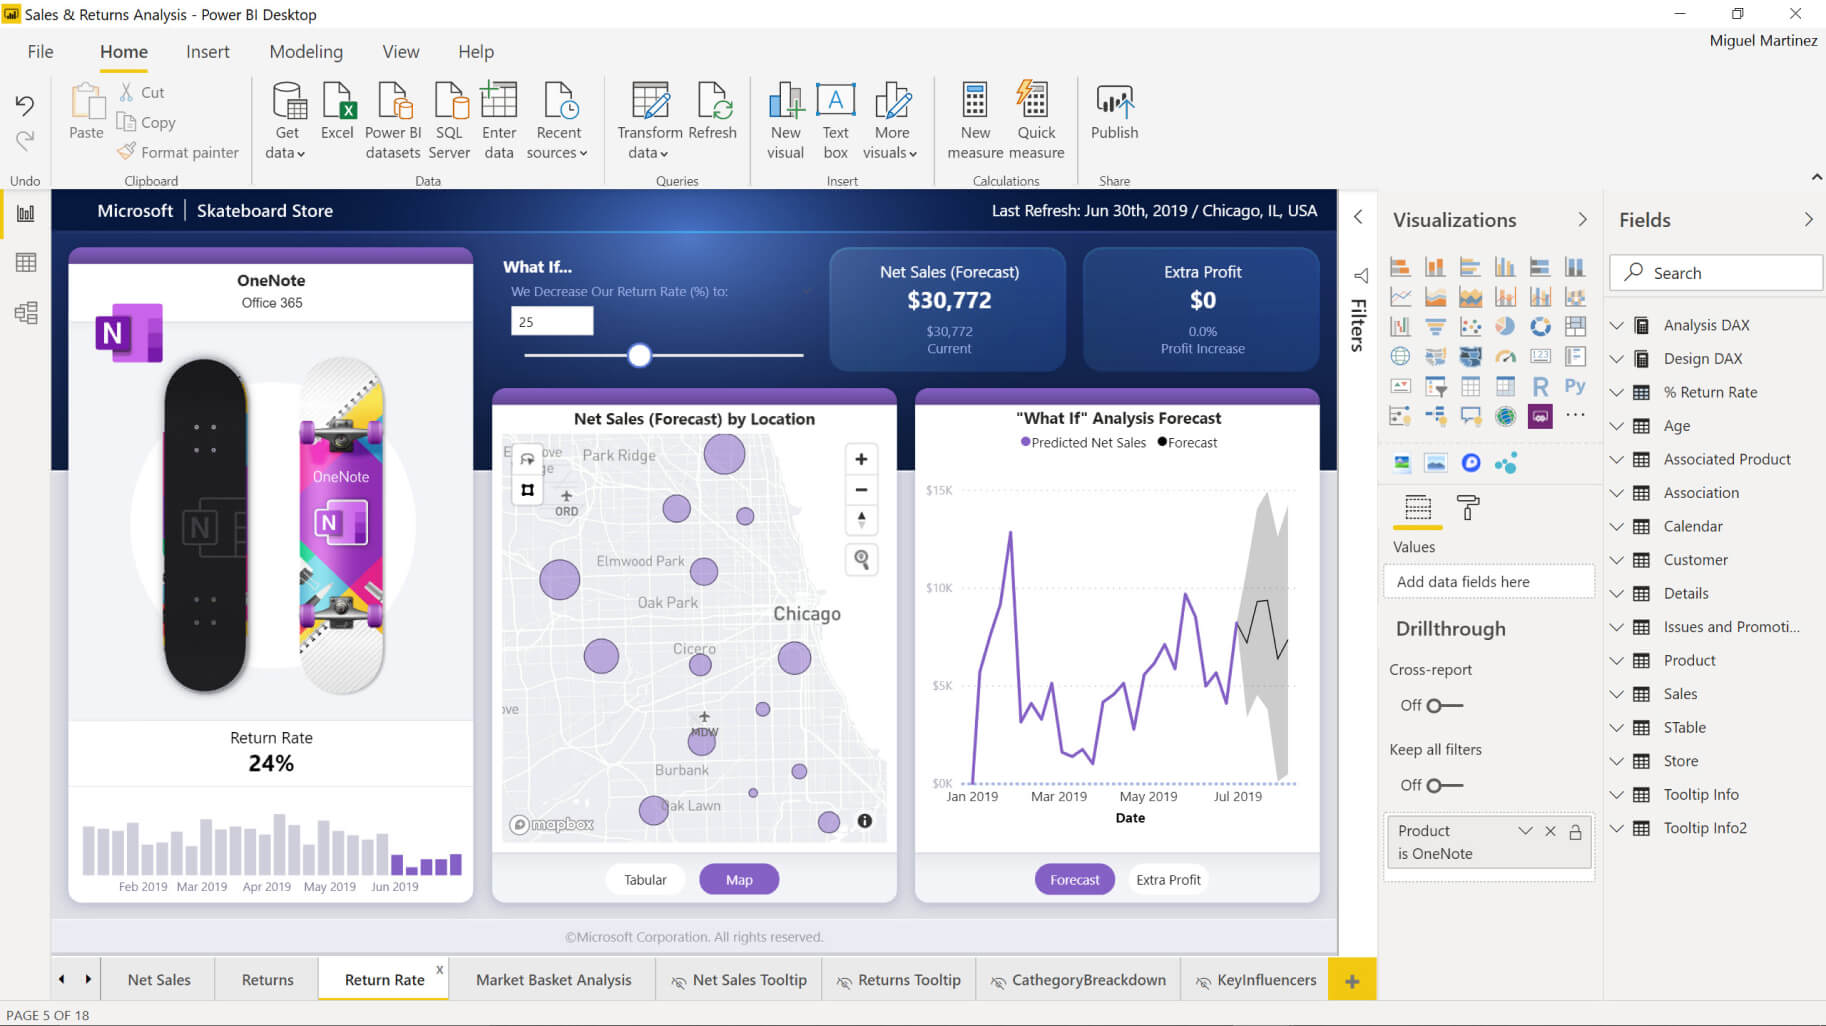
Microsoft Power BI: Analyzing data and discovering useful and timely insights from it used to be a job reserved for dedicated data analysts. As data storage and computing power have made access to data easier, tools have become available to help workers in many different roles analyze data to find insights and opportunities, and develop visual reports to show those insights, as well as report performance. In this lesson, you will describe data analysis and visualization for business intelligence (BI), and how users can perform self-service BI with Microsoft Power BI.

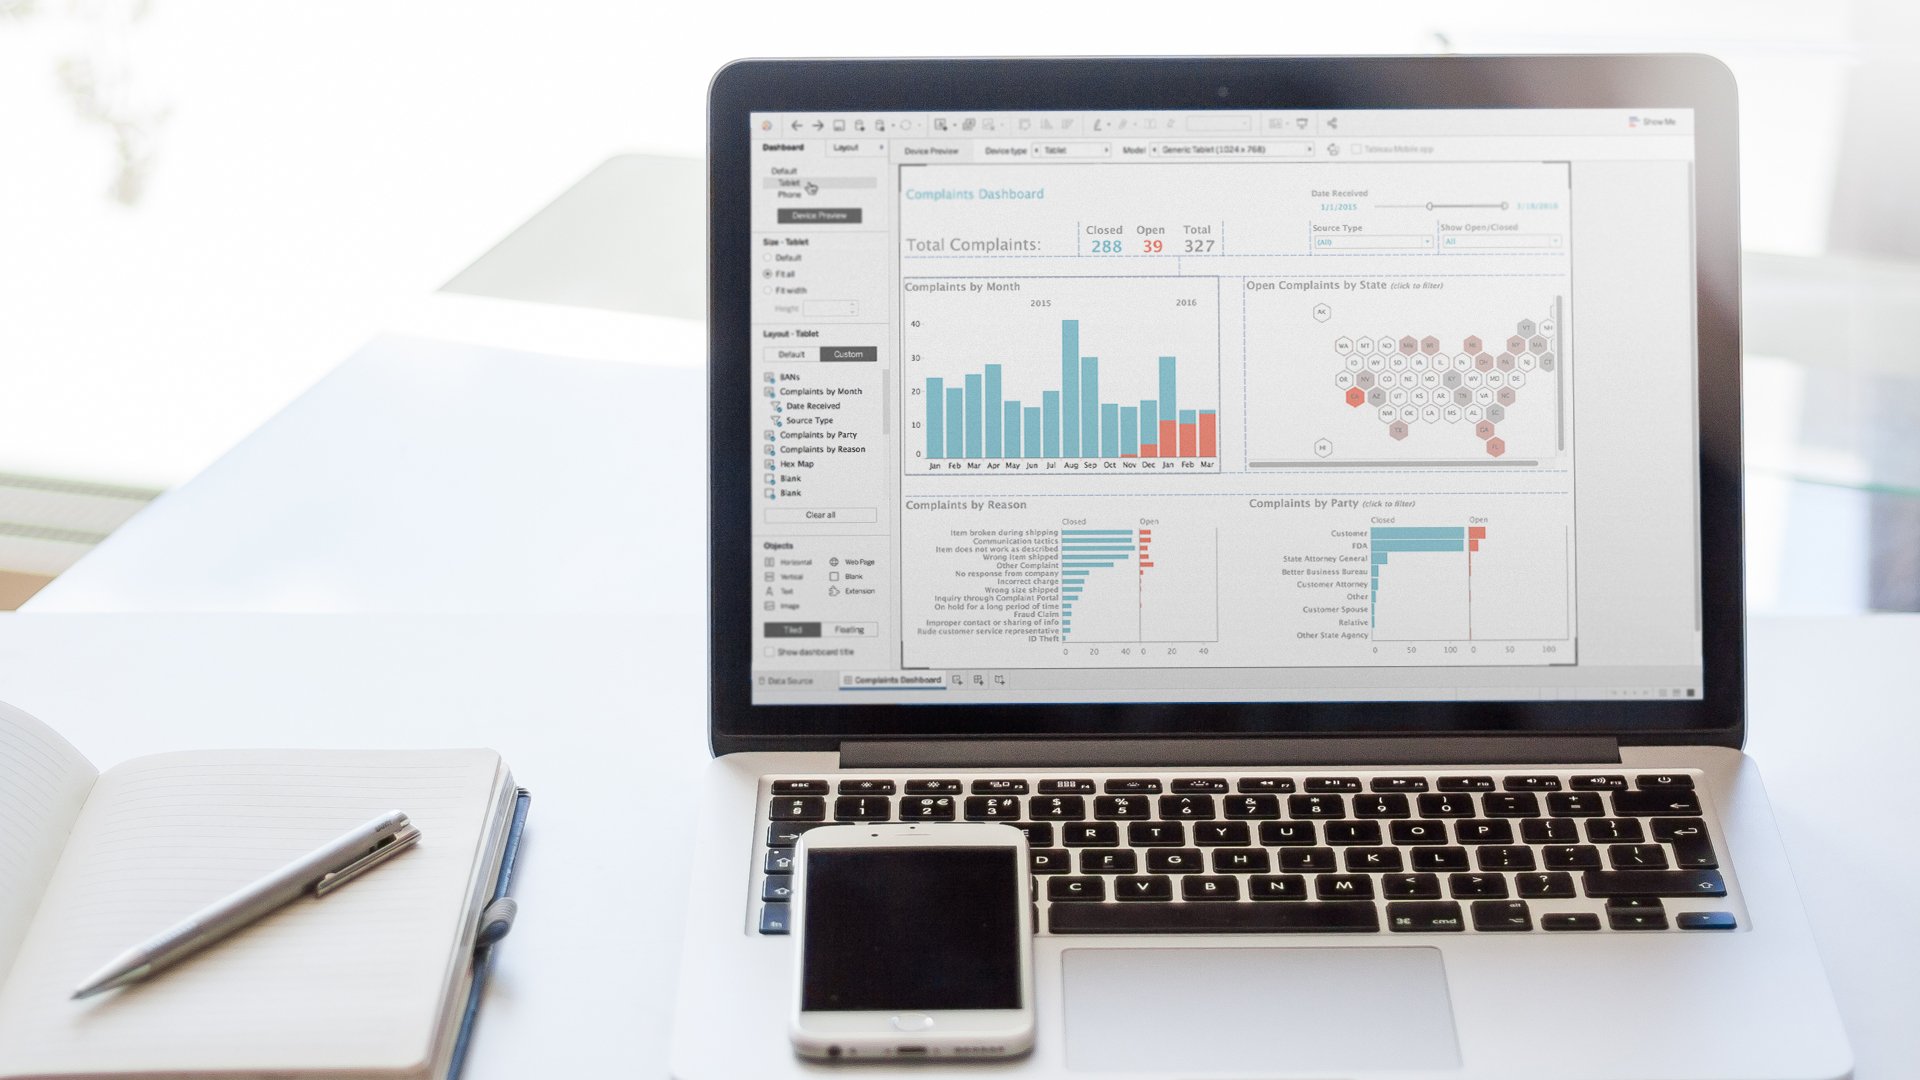
Tableau: Tableau is a tool for visualizing data. The visualizations created in Tableau can help users explore, analyze, and report insights. Before you can do any of those things, you must learn the fundamentals of the software, including what it’s designed to do, and how the user interface is laid out. In this lesson, you will learn the fundamentals of using Tableau for data visualization, exploration, and analysis.
Get Started Today

